---
title: "可视化"
---
## 森林图
```{r}
library(meta)
m.gen <- metagen(TE = TE,
                 seTE = seTE,
                 studlab = Author,
                 data = dmetar::ThirdWave,
                 sm = "SMD",
                 fixed = FALSE,
                 random = TRUE,
                 method.tau = "REML",
                 method.random.ci = "HK",
                 prediction = TRUE,
                 title = "Third Wave Psychotherapies")
```
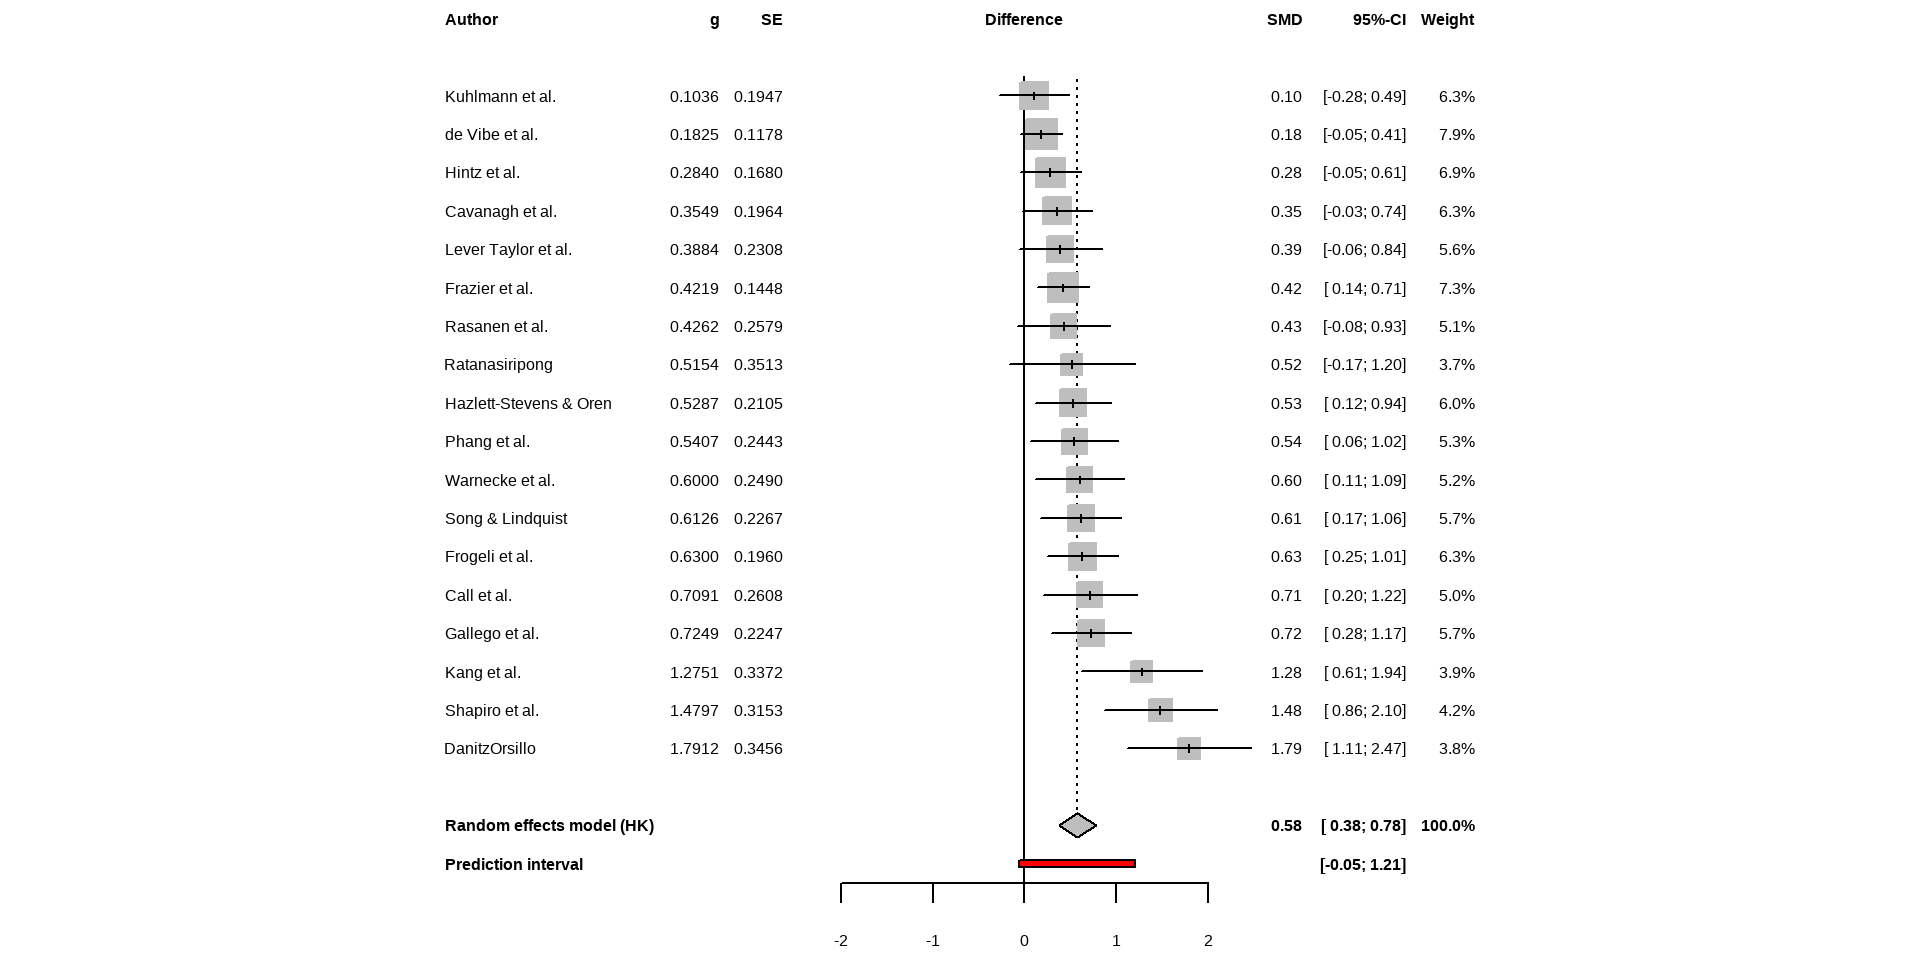
```{r fig.width=10}
meta::forest(m.gen,
             sortvar = TE,
             prediction = TRUE,
             print.tau2 = FALSE,
             leftlabs = c("Author", "g", "SE"))
```
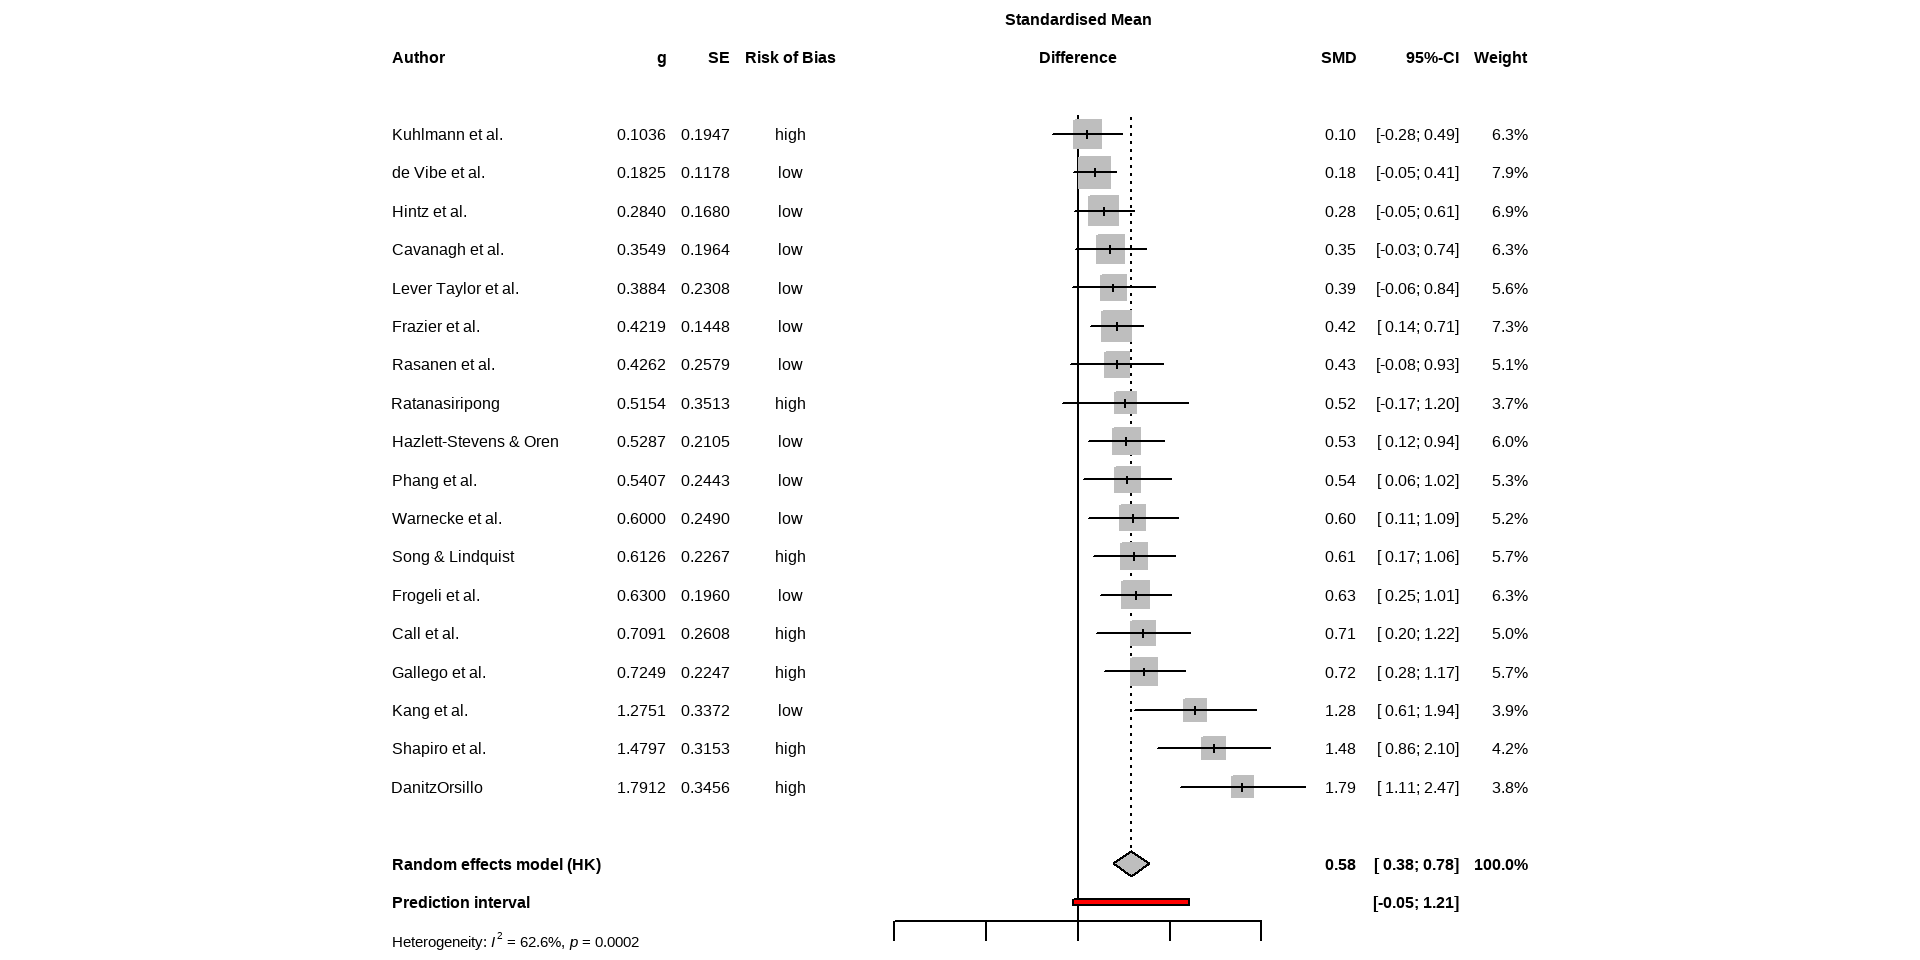
```{r fig.width=10}
meta::forest(m.gen,
             sortvar = TE,
             prediction = TRUE,
             print.tau2 = FALSE,
             leftcols = c("studlab", "TE", "seTE", "RiskOfBias"),
             leftlabs = c("Author", "g", "SE", "Risk of Bias"))
```
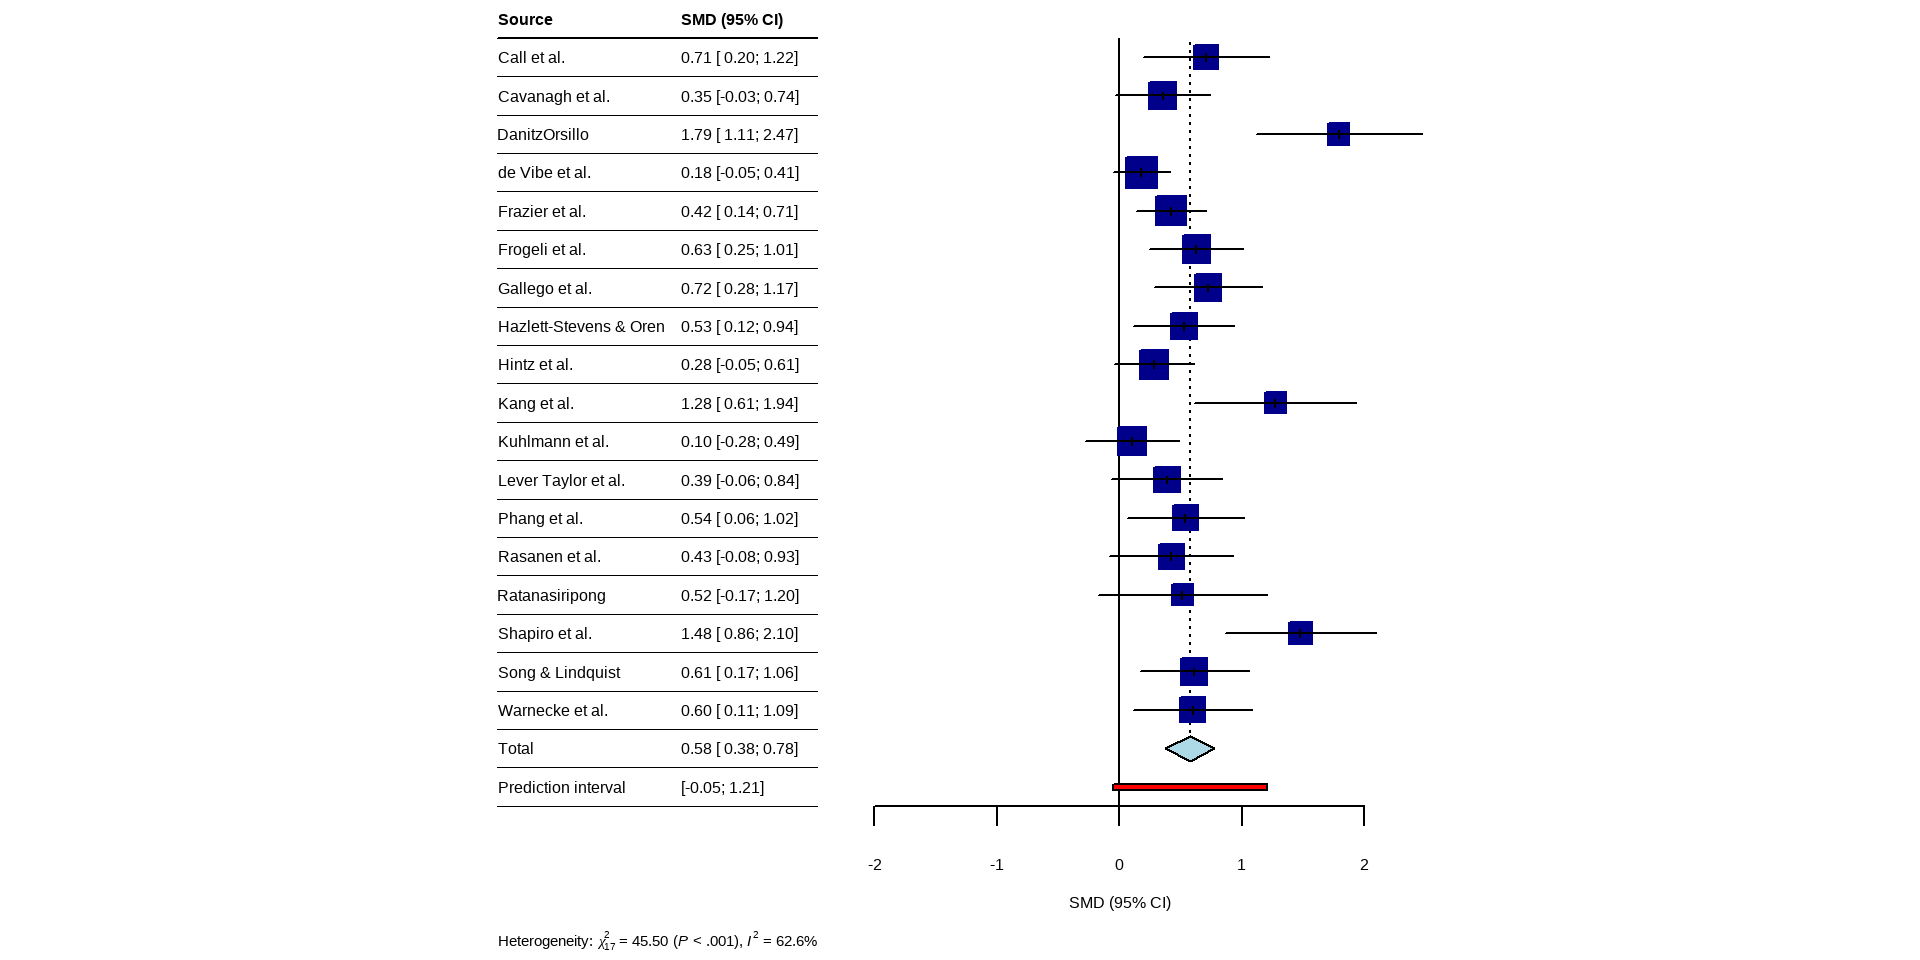
```{r fig.width=10}
meta::forest(m.gen, layout = "JAMA")
```
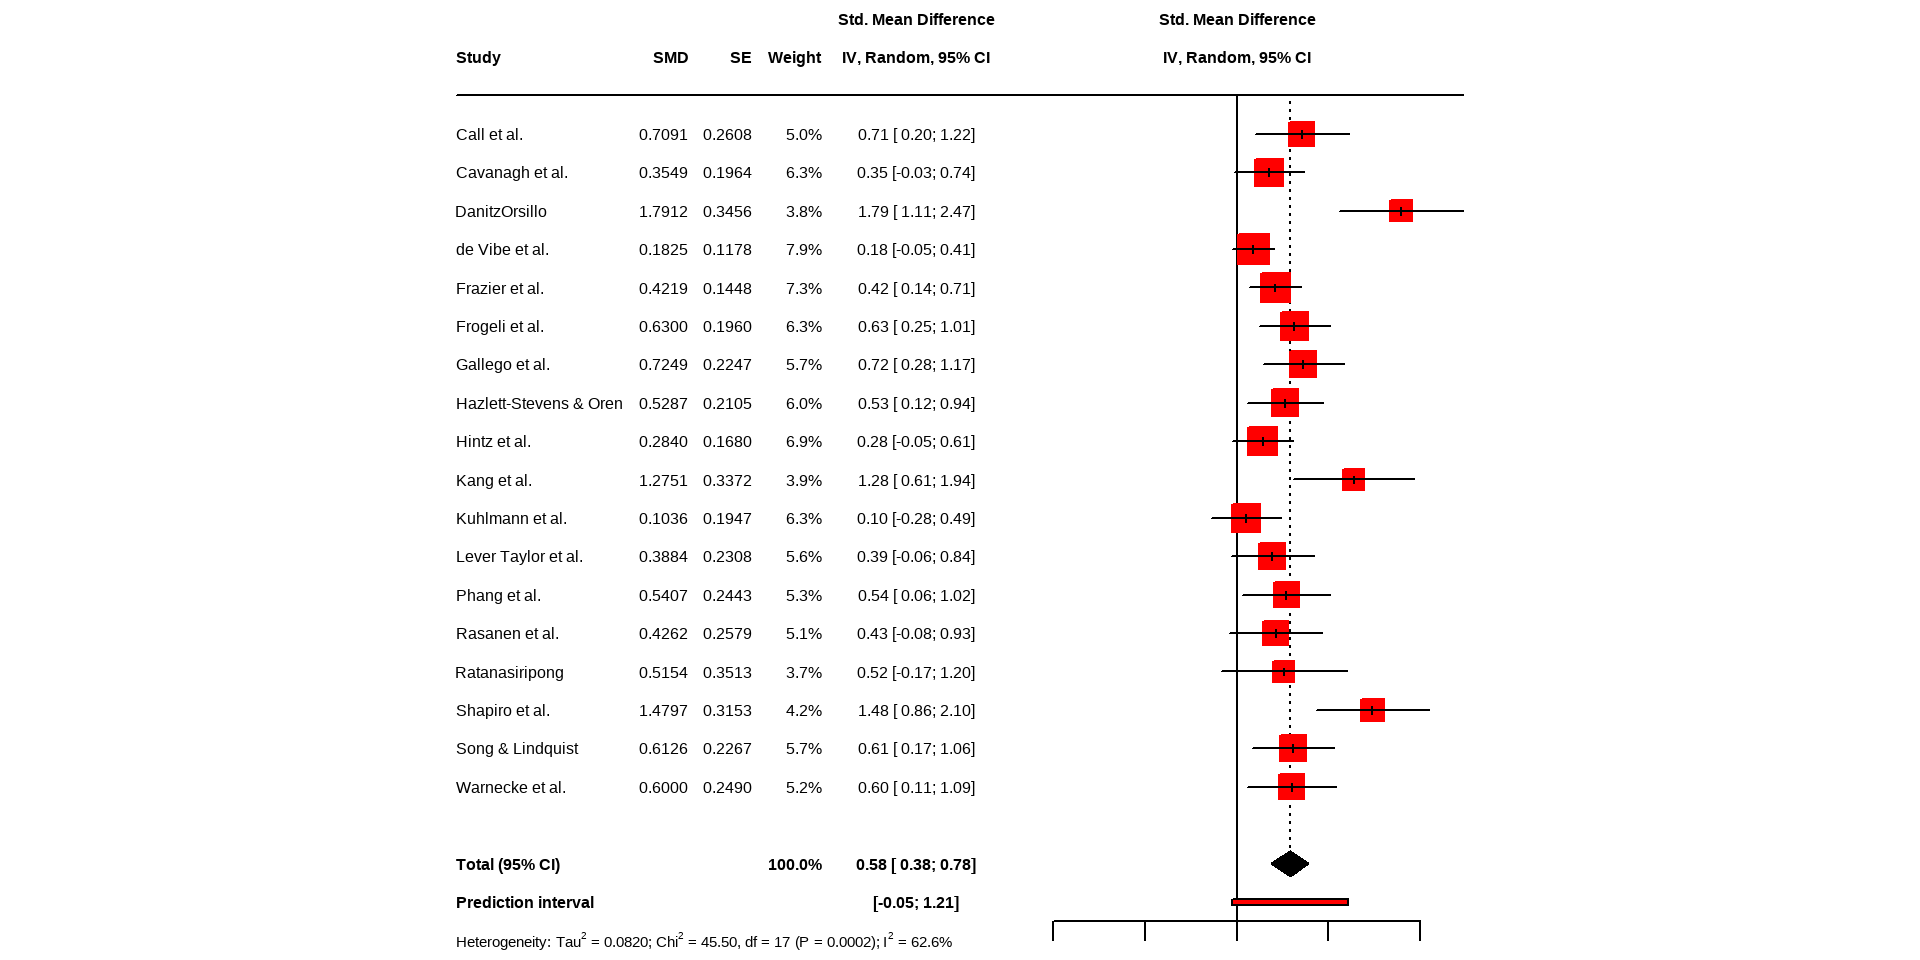
```{r fig.width=10}
meta::forest(m.gen, layout = "RevMan5")
```
```{r}
pdf(file = "images/forestplot.pdf", width = 8, height = 7)
meta::forest(m.gen,
sortvar = TE,
prediction = TRUE,
print.tau2 = FALSE,
leftlabs = c("Author", "g", "SE"))
dev.off()
```
```{r}
svg(file = "images/forestplot.svg", width = 8, height = 7)
meta::forest(m.gen,
sortvar = TE,
prediction = TRUE,
print.tau2 = FALSE,
leftlabs = c("Author", "g", "SE"))
dev.off()
```
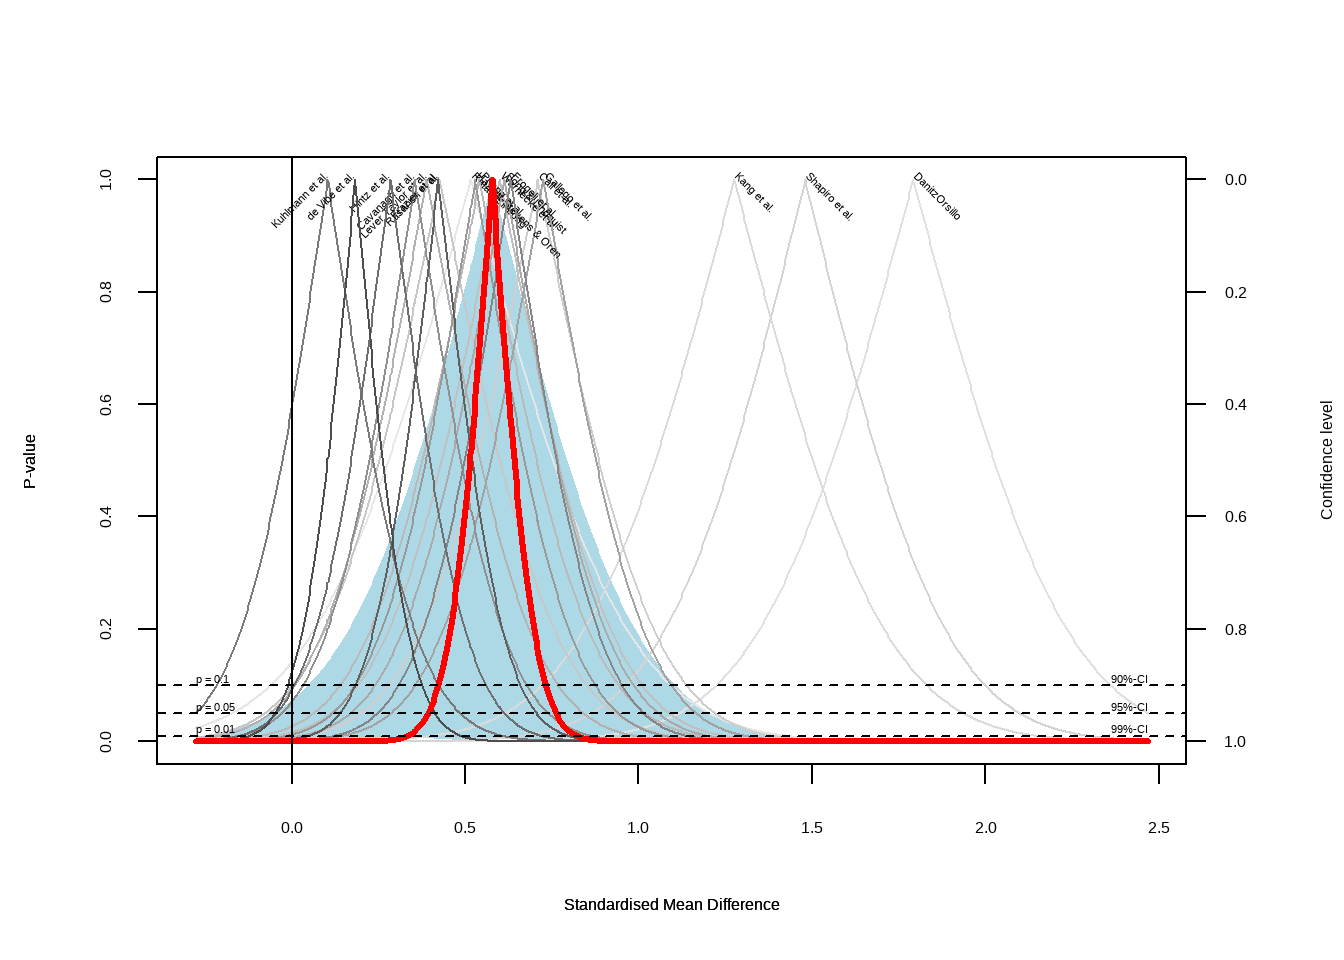
## Drapery Plots
```{r}
drapery(m.gen,
        labels = "studlab",
        type = "pval",
        legend = FALSE)
```