Code
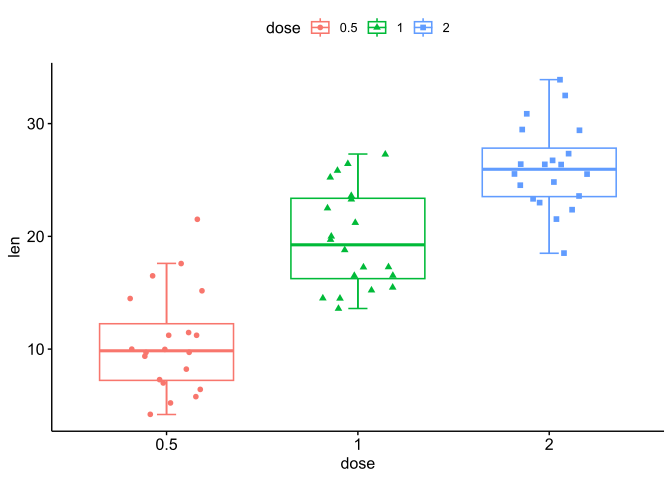
Code
my_compare <- list(c("0.5","1"),c("1","2"),c("0.5","2"))
p+stat_compare_means(comparisons = my_compare,method = "t.test")+
    stat_compare_means(label.y = 50)  # 总体p值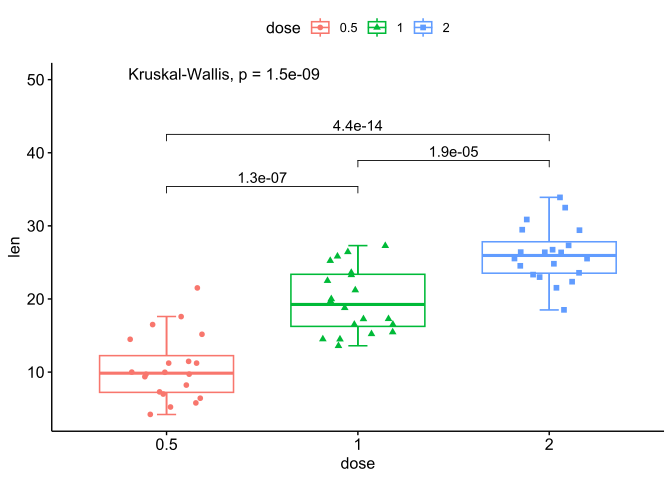
ggplot2 with Publication Ready Graphics in R
https://rpkgs.datanovia.com/ggpubr/
https://www.datanovia.com/en/blog/tag/ggpubr/
my_compare <- list(c("0.5","1"),c("1","2"),c("0.5","2"))
p+stat_compare_means(comparisons = my_compare,method = "t.test")+
stat_compare_means(label.y = 50) # 总体p值
ggviolin(data = df,
               x = "dose",
               y = "len",
               fill = "dose",
               palette = "gsea",

               add = "boxplot",
               add.params = list(fill="white"),
               )+
    stat_compare_means(comparisons = my_compare,
                       label = "p.signif",
                       method = "t.test")+
    stat_compare_means(label.y = 50)  # 总体p值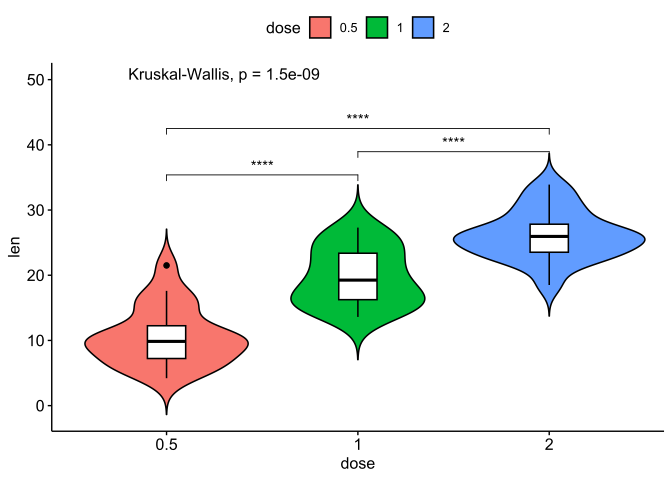
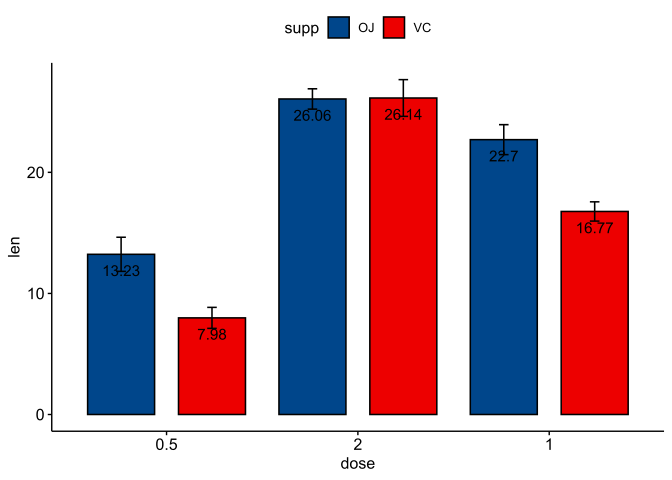
ggbarplot(
    data = df,
    x = "dose",
    y = "len",
    fill = "supp",
    color = "black",

    palette = "lancet",
    add = c("mean_se"),
    #  mean_sd, mean_ci

    error.plot = "errorbar",
    # upper_errorbar,"lower_errorbar",pointrange,"linerange", "crossbar",

    label = TRUE,
    lab.pos = "in",
    position = position_dodge(),
    orientation = "vertical",
    order = c("0.5", "2", "1"),
)
ToothGrowth$dose <- as.factor(ToothGrowth$dose)
# Comparisons against reference
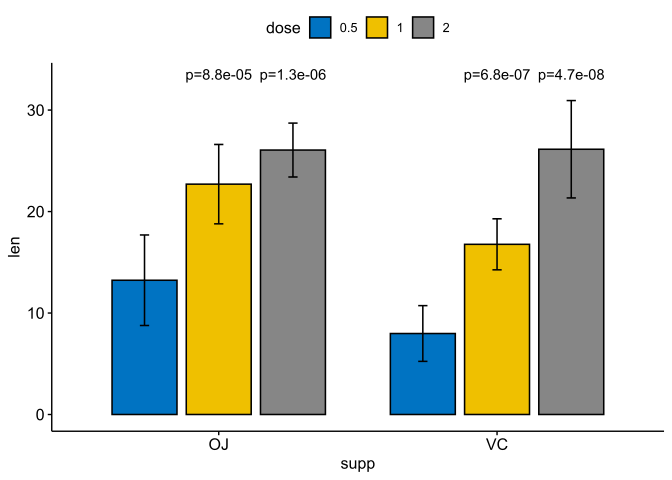
stat.test <- compare_means(
  len ~ dose, data = ToothGrowth, group.by = "supp",
  method = "t.test", ref.group = "0.5"
)
stat.test
#> # A tibble: 4 × 10
#>   supp  .y.   group1 group2            p       p.adj p.format p.signif method
#>   <fct> <chr> <chr>  <chr>         <dbl>       <dbl> <chr>    <chr>    <chr>
#> 1 VC    len   0.5    1      0.000000681  0.00000068  6.8e-07  ****     T-test
#> 2 VC    len   0.5    2      0.0000000468 0.000000094 4.7e-08  ****     T-test
#> 3 OJ    len   0.5    1      0.0000878    0.000088    8.8e-05  ****     T-test
#> 4 OJ    len   0.5    2      0.00000132   0.0000026   1.3e-06  ****     T-test
#> # ℹ 1 more variable: p.format.signif <chr>
bp <- ggbarplot(ToothGrowth, x = "supp", y = "len",
                fill = "dose", palette = "jco",
                add = "mean_sd", add.params = list(group = "dose"),
                position = position_dodge(0.8))
bp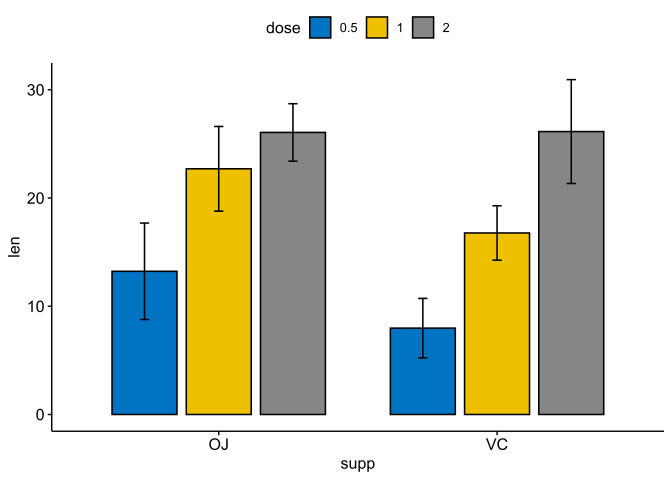
bp + stat_pvalue_manual(
  stat.test, x = "supp", y.position = 33,
  label = "p={p.format}",
  position = position_dodge(0.8)
)
library(ggpubr)
library(rstatix)
df <- ToothGrowth
df$dose <- as.factor(df$dose)


bp <- ggbarplot(
    df,
    x = "dose",
    y = "len",
    add = "mean_sd",
    color = "supp",
    palette = c("#00AFBB", "#E7B800"),
    position = position_dodge(0.8)
)


# 统计检验
stat.test <- df %>%
    group_by(dose) %>%
    t_test(len ~ supp) %>%
    adjust_pvalue(method = "bonferroni") %>%
    add_significance("p.adj")
stat.test <- stat.test %>%
    add_xy_position(fun = "mean_sd", x = "dose", dodge = 0.8)


stat.test2 <- df %>%
    t_test(len ~ dose, p.adjust.method = "bonferroni")
stat.test2 <- stat.test2 %>%
    add_xy_position(x = "dose")

pwc <- df %>%
    group_by(supp) %>%
    t_test(len ~ dose, p.adjust.method = "bonferroni")
pwc
#> # A tibble: 6 × 11
#>   supp  .y.   group1 group2    n1    n2 statistic    df            p       p.adj
#> * <fct> <chr> <chr>  <chr>  <int> <int>     <dbl> <dbl>        <dbl>       <dbl>
#> 1 OJ    len   0.5    1         10    10     -5.05  17.7 0.0000878    0.000264
#> 2 OJ    len   0.5    2         10    10     -7.82  14.7 0.00000132   0.00000397
#> 3 OJ    len   1      2         10    10     -2.25  15.8 0.0392       0.118
#> 4 VC    len   0.5    1         10    10     -7.46  17.9 0.000000681  0.00000204
#> 5 VC    len   0.5    2         10    10    -10.4   14.3 0.0000000468 0.000000140
#> 6 VC    len   1      2         10    10     -5.47  13.6 0.0000916    0.000275
#> # ℹ 1 more variable: p.adj.signif <chr>
pwc <- pwc %>%
    add_xy_position(
        x = "dose",
        fun = "mean_sd",
        group = "supp",
        dodge = 0.8
    )

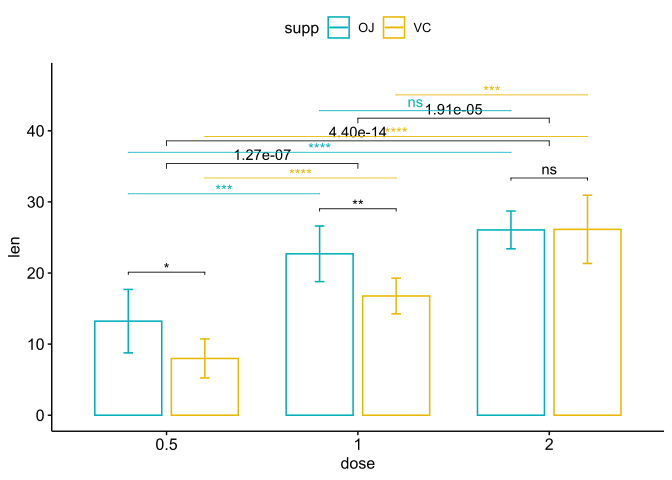
# 组间组内复合


bp +
    stat_pvalue_manual(stat.test,  label = "p.adj.signif", tip.length = 0.01) +
    stat_pvalue_manual(
        stat.test2,
        label = "p",
        tip.length = 0.02,
        step.increase = 0.05
    ) +
    scale_y_continuous(expand = expansion(mult = c(0.05, 0.1))) +
    stat_pvalue_manual(
        pwc,
        color = "supp",
        step.group.by = "supp",
        tip.length = 0,
        step.increase = 0.1
    )
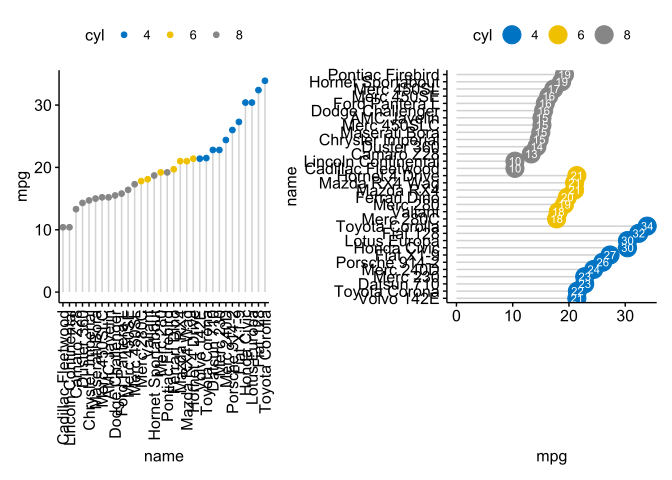
library(patchwork)
# 滑珠图
mtcars |> rownames_to_column(var = "name") |>
    mutate(
        cyl=factor(cyl)
    ) |>
    ggdotchart(
        x = "name",
        y = "mpg",
        color = "cyl",
        palette = "jco",

        sorting = "ascending",
        add = "segments",
        ggtheme = theme_pubr()
    ) |
#克利夫兰点图
mtcars |> rownames_to_column(var = "name") |>
    mutate(
        cyl=factor(cyl)
    ) |>
    ggdotchart(
        x = "name",
        y = "mpg",
        color = "cyl",
        palette = "jco",

        sorting = "descending",
        add = "segments",

        rotate = TRUE,
        group = "cyl",
        dot.size = 6,
        label = round(mtcars$mpg),
        font.label = list(color="white",size=9,vjust=0.5),
        ggtheme = theme_pubr()
    )